您现在的位置是:网站首页>>Linux运维Linux运维
Elastic Stack——ELKB项目部署
发布时间:2018-05-08 17:05:43分类:Linux运维阅读:1329
一、概述
利用开源的Elastic Stack技术栈中的Elasticsearch+Logstash+Kibana+Beats构建日志收集分析系统,对Nginx日志进行收集分析并以图形状态展示。
项目思路如图:
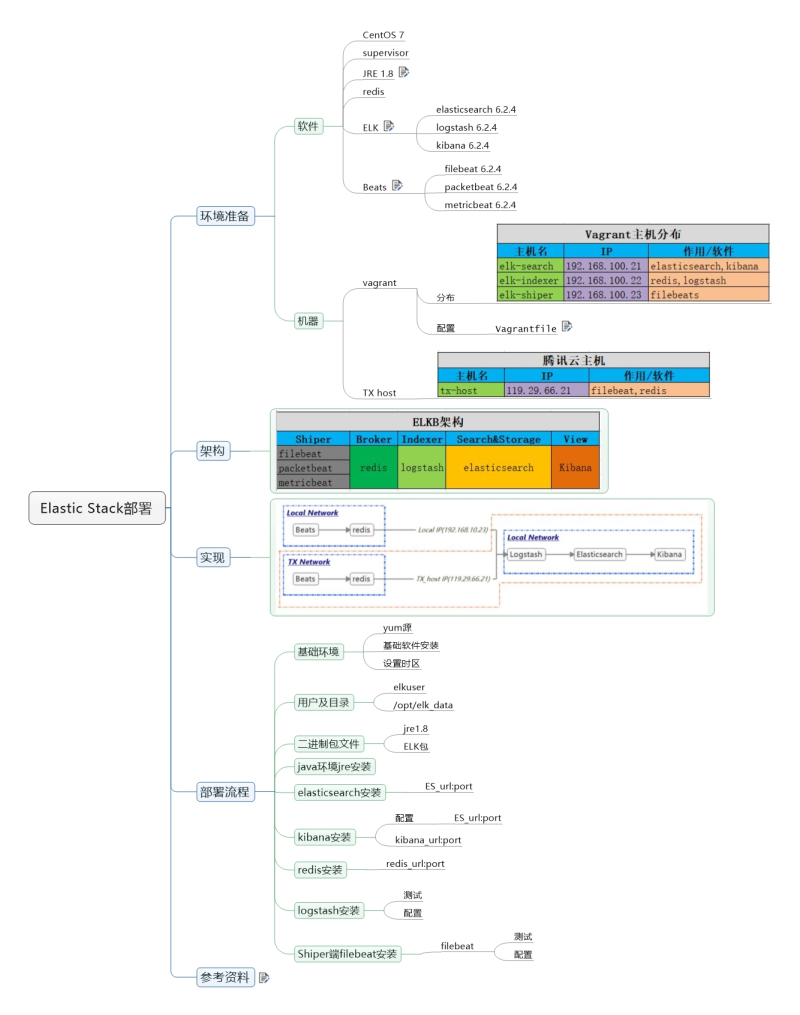
二、环境准备
1、软件
(1) CentOS 7
(2) supervisor
(3) JRE 1.8
(4) redis
(5) ELK
elasticsearch 6.2.4
logstash 6.2.4
kibana 6.2.4
(6) Beats
filebeat 6.2.4
packetbeat 6.2.4
metricbeat 6.2.4
2、机器
|
Vagrant主机分布 |
||
|
主机名 |
IP |
作用/软件 |
|
elk-search |
192.168.100.21 |
elasticsearch,kibana |
|
elk-indexer |
192.168.100.22 |
redis,logstash |
|
elk-shiper |
192.168.100.23 |
filebeat |
|
腾讯云主机 |
||
|
主机名 |
IP |
作用/软件 |
|
tx-host |
119.29.66.21 |
filebeat,redis |
三、架构
|
ELKB架构 |
||||
|
Shiper |
Broker |
Indexer |
Search&Store |
View |
|
filebeat |
redis |
logstash |
elasticsearch |
Kibana |
|
packetbeat |
||||
|
metricbeat |
||||
四、实现
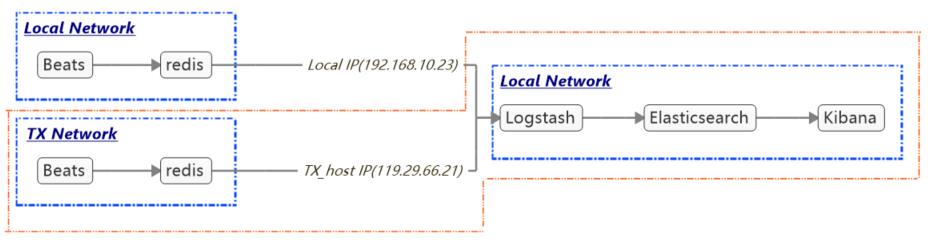
描述:
(1)ELK部署在一个局域网内;
(2)不同网络(Local Network / TX Network)的数据采集汇集到redis中(便于根据网络索引,公网与局域网数据统一传递,保障数据安全);
(3)Logstash通过从不同网络的redis获取相应网络的数据;
本项目实现如图中橙色部分:
因为刚好有台腾讯云主机上面部署了Nginx服务,所以本项目主要实现采集某台腾讯云主机的Nginx日志,并传递到该云主机的redis中,然后局域网内的ELK环境通过Logstash从云主机的redis中获取数据,然后进行分析处理。
五、部署流程
1、基础环境
1.1添加yum源
yum install https://dl.fedoraproject.org/pub/epel/epel-release-latest-7.noarch.rpm
1.2安装基础软件
[root@elk-search ~]# yum install vim net-tools supervisor
[root@elk-indexer ~]# yum install vim net-tools supervisor
1.3设置时区
[root@elk-search ~]# timedatectl set-timezone Asia/Shanghai
[root@elk-indexer ~]# timedatectl set-timezone Asia/Shanghai
2、添加用户及项目根目录(elk-search和elk-indexer主机)
[root@elk-search ~]# useradd -d /opt/elk_data elkuser
[root@elk-indexer ~]# useradd -d /opt/elk_data elkuser
3、从官网下载相应的二进制包文件
3.1下载链接如下
Jre1.8:
ELK相应的包:
https://www.elastic.co/cn/downloads
3.2切换用户elkuser,进入到/opt/elk_data目录
[root@elk-search ~]# su -l elkuser
[elkuser@elk-search ~]$ pwd
/opt/elk_data
[elkuser@elk-search ~]$ ll
total 190992
-rw-rw-r--. 1 elkuser elkuser 29056810 Apr 23 02:38 elasticsearch-6.2.4.tar.gz
-rw-rw-r--. 1 elkuser elkuser 81166060 Apr 23 02:38 jre-8u171-linux-x64.tar.gz
-rw-rw-r--. 1 elkuser elkuser 85348919 Apr 23 02:38 kibana-6.2.4-linux-x86_64.tar.gz

[root@elk-indexer ~]# su -l elkuser
[elkuser@elk-indexer ~]$ pwd
/opt/elk_data
[elkuser@elk-indexer ~]$ ll
total 223040
-rw-rw-r--. 1 elkuser elkuser  81166060 Apr 23 02:38 jre-8u171-linux-x64.tar.gz
-rw-rw-r--. 1 elkuser elkuser 147224408 Apr 23 02:38 logstash-6.2.4.tar.gz
4、java环境jre安装(elk-search和elk-indexer主机)
4.1解包jre-8u171-linux-x64.tar.gz
[elkuser@elk-search ~]$ tar -zxvf jre-8u171-linux-x64.tar.gz
[elkuser@elk-indexer ~]$ tar -zxvf jre-8u171-linux-x64.tar.gz
4.2添加java环境变量到elkuser用户下
[elkuser@elk-search ~]$ grep -v '^#' /opt/elk_data/.bashrc
if [ -f /etc/bashrc ]; then
         . /etc/bashrc
fi

JAVA_HOME=/opt/elk_data/jre1.8.0_171
PATH=$JAVA_HOME/bin:$PATH
CLASSPATH=$JAVA_HOME/lib

export JAVA_HOME PATH CLASSPATH
[elkuser@elk-indexer ~]$ grep -v '^#' /opt/elk_data/.bashrc

if [ -f /etc/bashrc ]; then
         . /etc/bashrc
fi


JAVA_HOME=/opt/elk_data/jre1.8.0_171
PATH=$JAVA_HOME/bin:$PATH
CLASSPATH=$JAVA_HOME/lib

export JAVA_HOME PATH CLASSPATH
4.3加载环境变量
[elkuser@elk-search ~]$ source .bashrc
[elkuser@elk-search ~]$ echo $PATH
/opt/elk_data/jre1.8.0_171/bin:/sbin:/bin:/usr/sbin:/usr/bin
[elkuser@elk-indexer ~]$ source .bashrc
[elkuser@elk-indexer ~]$ echo $PATH
/opt/elk_data/jre1.8.0_171/bin:/sbin:/bin:/usr/sbin:/usr/bin
4.4检查java是否安装正常
[elkuser@elk-search ~]$ java -version
java version "1.8.0_171"
Java(TM) SE Runtime Environment (build 1.8.0_171-b11)
Java HotSpot(TM) 64-Bit Server VM (build 25.171-b11, mixed mode)
[elkuser@elk-indexer ~]$ java -version
java version "1.8.0_171"
Java(TM) SE Runtime Environment (build 1.8.0_171-b11)
Java HotSpot(TM) 64-Bit Server VM (build 25.171-b11, mixed mode)
5、 elasticsearch安装(elk-search主机)
5.1修改内核参数(不改试试,运行会报错哦!!)
[root@elk-search ~]# grep -v '^#' /etc/sysctl.conf
vm.max_map_count= 262144
[root@elk-search ~]# sysctl -p
vm.max_map_count = 262144
添加文件/etc/security/limits.d/elk-limits.conf,修改用户最大文件句柄数限制
elkuser soft nofile 65536
elkuser hard nofile 65536
elkuser soft nproc 4096    #最小要为4096
检查:
[elkuser@elk-search ~]$ ulimit -a
[elkuser@elk-search ~]$ ulimit -a
core file size          (blocks, -c) 0
data seg size           (kbytes, -d) unlimited
scheduling priority             (-e) 0
file size               (blocks, -f) unlimited
pending signals                 (-i) 7288
max locked memory       (kbytes, -l) 64
max memory size         (kbytes, -m) unlimited
open files                      (-n) 65536
pipe size            (512 bytes, -p) 8
POSIX message queues     (bytes, -q) 819200
real-time priority              (-r) 0
stack size              (kbytes, -s) 8192
cpu time               (seconds, -t) unlimited
max user processes              (-u) 4096
virtual memory          (kbytes, -v) unlimited
file locks                      (-x) unlimited
5.2解包
[elkuser@elk-search ~]$ tar -zxvf elasticsearch-6.2.4.tar.gz
5.3配置
[elkuser@elk-search ~]$ grep -v '^#' elasticsearch-6.2.4/config/elasticsearch.yml
cluster.name: elk-cluster
node.name: elk-node-1
path.data: /opt/elk_data/elasticsearch-6.2.4/data    #如果运行多个elasticsearch,需要指定不同的path.data,命令行运行参数为--path.data
path.logs: /opt/elk_data/elasticsearch-6.2.4/logs
network.host: 192.168.10.21
http.port: 9200
5.4命令行启动并测试
[elkuser@elk-search ~]$ ./elasticsearch-6.2.4/bin/elasticsearch
打开另一个终端测试
[elkuser@elk-search ~]$ curl http://192.168.10.21:9200
{
"name" : "elk-node-1",
"cluster_name" : "elk-cluster",
"cluster_uuid" : "MXRhKrLkRFeK4_EwtV7IZA",
"version" : {
"number" : "6.2.4",
"build_hash" : "ccec39f",
"build_date" : "2018-04-12T20:37:28.497551Z",
"build_snapshot" : false,
"lucene_version" : "7.2.1",
"minimum_wire_compatibility_version" : "5.6.0",
"minimum_index_compatibility_version" : "5.0.0"
  },
"tagline" : "You Know, for Search"
}
5.5使用supervisor配置
(1)配置supervisor
[elkuser@elk-search ~]# grep -v '^;' /etc/supervisord.conf | grep -v '^$'
[unix_http_server]
file=/var/run/supervisor/supervisor.sock   ; (the path to the socket file)
[supervisord]
logfile=/var/log/supervisor/supervisord.log  ; (main log file;default $CWD/supervisord.log)
logfile_maxbytes=50MB       ; (max main logfile bytes b4 rotation;default 50MB)
logfile_backups=10          ; (num of main logfile rotation backups;default 10)
loglevel=info               ; (log level;default info; others: debug,warn,trace)
pidfile=/var/run/supervisord.pid ; (supervisord pidfile;default supervisord.pid)
nodaemon=false              ; (start in foreground if true;default false)
minfds=65536                ; (min. avail startup file descriptors;default 1024)
minprocs=200                ; (min. avail process descriptors;default 200)
[rpcinterface:supervisor]
supervisor.rpcinterface_factory = supervisor.rpcinterface:make_main_rpcinterface
[supervisorctl]
serverurl=unix:///var/run/supervisor/supervisor.sock ; use a unix:// URL  for a unix socket
[include]
files = supervisord.d/*.ini
------------------------------------------------------------------------------------------------------------------------------
[root@elk-search ~]# cat /etc/supervisord.d/elk-elasticsearch.ini
[program:elk-elasticsearch]
command = /opt/elk_data/elasticsearch-6.2.4/bin/elasticsearch
directory=/opt/elk_data/elasticsearch-6.2.4/
environment=JAVA_HOME=/opt/elk_data/jre1.8.0_171
autostart = true
autorestart = true
startsecs = 5
startretries = 3
user = elkuser
(2)启动supervisor
[root@elk-search ~]# systemctl start supervisord.service
或
[root@elk-search ~]# supervisord -c /etc/supervisord.conf
5.6测试
[elkuser@elk-search ~]$ curl http://192.168.10.21:9200
{
"name" : "elk-node-1",
"cluster_name" : "elk-cluster",
"cluster_uuid" : "MXRhKrLkRFeK4_EwtV7IZA",
"version" : {
"number" : "6.2.4",
"build_hash" : "ccec39f",
"build_date" : "2018-04-12T20:37:28.497551Z",
"build_snapshot" : false,
"lucene_version" : "7.2.1",
"minimum_wire_compatibility_version" : "5.6.0",
"minimum_index_compatibility_version" : "5.0.0"
  },
"tagline" : "You Know, for Search"
}
6、 kibana安装(elk-search主机)
6.1解包
[elkuser@elk-search ~]$ tar -zxvf kibana-6.2.4-linux-x86_64.tar.gz
6.2配置
[elkuser@elk-search ~]$ grep -Ev '^#|^$' kibana-6.2.4-linux-x86_64/config/kibana.yml
server.port: 5601
server.host: "0.0.0.0"
elasticsearch.url: "http://192.168.10.21:9200"
elasticsearch.preserveHost: true
kibana.index: ".kibana"
6.3命令行启动并测试
[elkuser@elk-search ~]$ ./kibana-6.2.4-linux-x86_64/bin/kibana
在浏览器中输入地址测试:
6.4使用supervisor配置
[root@elk-search ~]# cat /etc/supervisord.d/elk-kibana.ini
[program:elk-kibana]
command = /opt/elk_data/kibana-6.2.4-linux-x86_64/bin/kibana
directory=/opt/elk_data/kibana-6.2.4-linux-x86_64
environment=JAVA_HOME=/opt/elk_data/jre1.8.0_171
autostart = true
autorestart = true
startsecs = 5
startretries = 3
user = elkuser
6.5使用supervisor启动并测试
[root@elk-search ~]# systemctl restart supervisord.service
在浏览器中输入http://192.168.10.21:5601进行测试
【注意:步骤7和8主要测试redis配合ELK,后续可直接修改logstash中的redis配置即可调用TX Network中的redis获取数据】
7、redis安装(elk-indexer主机)
7.1安装
[root@elk-indexer ~]# yum install redis
7.2修改配置/etc/redis.conf中相应值
bind 192.168.10.22
requirepass 'redis123pass'
7.3启动
[root@elk-indexer ~]# systemctl start redis.service
7.4测试
[root@elk-indexer ~]# redis-cli -h 192.168.10.22 -p 6379 -a 'redis123pass'
192.168.10.22:6379> set hw 'Hello World'
OK
192.168.10.22:6379> get hw
"Hello World"
8、 logstash安装(elk-indexer主机)
8.1解包
[elkuser@elk-indexer ~]$ tar -zxvf logstash-6.2.4.tar.gz
8.2简单测试
[elkuser@elk-indexer ~]$ ./logstash-6.2.4/bin/logstash -e 'input{ stdin{ }} output{ stdout{codec=>rubydebug}}'
……省略部分……
The stdin plugin is now waiting for input:
Hello World
{
"@timestamp" => 2018-04-24T09:08:05.604Z,
"@version" => "1",
"message" => "Hello World",
"host" => "elk-indexer"
}
8.3配置
[elkuser@elk-indexer ~]$ grep -Ev '^#|^$' logstash-6.2.4/config/logstash.yml
node.name: elk-logstash-node-1
----------------------------------------------------------------------------------------------------------
[elkuser@elk-indexer ~]$ cat logstash-6.2.4/config/conf.d/logstash-redis.conf
input {
    # https://www.elastic.co/guide/en/logstash-versioned-plugins/current/v3.2.2-plugins-inputs-redis.html#v3.2.2-plugins-inputs-redis-options
redis {
batch_count => 1
data_type => "list"
key => "logstash-list"
host => "192.168.10.22"
port => 6379
password => "redis123pass"
db => 0
threads => 5
    }
}

output {
stdout {
codec => "rubydebug"
    }

}
8.4测试配置
(1)测试配置文件
[elkuser@elk-indexer ~]$ ./logstash-6.2.4/bin/logstash -f config/conf.d/logstash-redis.conf -t
……省略部分……
Configuration OK
-----------------------------------------------------------------------------------------------
(2)测试配置效果
在第一个终端执行logstash命令并等待:
[elkuser@elk-indexer logstash-6.2.4]$ ./bin/logstash -f config/conf.d/logstash-redis.conf
Sending Logstash's logs to /opt/elk_data/logstash-6.2.4/logs which is now configured via log4j2.properties
[2018-04-29T08:19:10,394][INFO ][logstash.modules.scaffold] Initializing module {:module_name=>"fb_apache", :directory=>"/opt/elk_data/logstash-6.2.4/modules/fb_apache/configuration"}
[2018-04-29T08:19:10,416][INFO ][logstash.modules.scaffold] Initializing module {:module_name=>"netflow", :directory=>"/opt/elk_data/logstash-6.2.4/modules/netflow/configuration"}
[2018-04-29T08:19:11,123][WARN ][logstash.config.source.multilocal] Ignoring the 'pipelines.yml' file because modules or command line options are specified
[2018-04-29T08:19:11,985][INFO ][logstash.runner          ] Starting Logstash {"logstash.version"=>"6.2.4"}
[2018-04-29T08:19:12,529][INFO ][logstash.agent           ] Successfully started Logstash API endpoint {:port=>9600}
[2018-04-29T08:19:16,002][INFO ][logstash.pipeline        ] Starting pipeline {:pipeline_id=>"main", "pipeline.workers"=>2, "pipeline.batch.size"=>125, "pipeline.batch.delay"=>50}
[2018-04-29T08:19:16,172][INFO ][logstash.inputs.redis    ] Registering Redis {:identity=>"redis://<password>@192.168.10.22:6379/0 list:logstash-list"}
[2018-04-29T08:19:16,174][INFO ][logstash.inputs.redis    ] Registering Redis {:identity=>"redis://<password>@192.168.10.22:6379/0 list:logstash-list"}
[2018-04-29T08:19:16,175][INFO ][logstash.inputs.redis    ] Registering Redis {:identity=>"redis://<password>@192.168.10.22:6379/0 list:logstash-list"}
[2018-04-29T08:19:16,175][INFO ][logstash.inputs.redis    ] Registering Redis {:identity=>"redis://<password>@192.168.10.22:6379/0 list:logstash-list"}
[2018-04-29T08:19:16,175][INFO ][logstash.inputs.redis    ] Registering Redis {:identity=>"redis://<password>@192.168.10.22:6379/0 list:logstash-list"}
[2018-04-29T08:19:16,297][INFO ][logstash.pipeline        ] Pipeline started successfully {:pipeline_id=>"main", :thread=>"#<Thread:0x7cba1f51 run>"}
[2018-04-29T08:19:16,470][INFO ][logstash.agent           ] Pipelines running {:count=>1, :pipelines=>["main"]}
然后,在另一个终端执行redis客户端命令:
[elkuser@elk-indexer ~]$ redis-cli -h 192.168.10.22 -p 6379 -a 'redis123pass'
192.168.10.22:6379> rpush logstash-list '{"message":"Hello World","host":"192.168.10.22"}'
(integer) 1
第一个终端会输出相应结果:
{
"@timestamp" => 2018-04-29T00:22:27.835Z,
"host" => "192.168.10.22",
"message" => "Hello World",
"@version" => "1"
}
8.5修改配置并检测配置文件
[elkuser@elk-indexer ~]$ cat logstash-6.2.4/config/conf.d/logstash-redis.conf
input {
    # https://www.elastic.co/guide/en/logstash-versioned-plugins/current/v3.2.2-plugins-inputs-redis.html#v3.2.2-plugins-inputs-redis-options
    redis {
        batch_count => 1
        data_type => "list"
        key => "logstash-list"
        host => "192.168.10.22"
        port => 6379
        password => "redis123pass"
        db => 0
        threads => 5
    }
}
output {
    # https://www.elastic.co/guide/en/logstash-versioned-plugins/current/v3.0.5-plugins-outputs-boundary.html#v3.0.5-plugins-outputs-boundary-options
#    stdout {
#        codec => "rubydebug"
#    }
    elasticsearch {
        hosts => ["192.168.10.21:9200"]
        index => "logstash-%{type}-%{+YYYY.MM.dd}"    #默认"logstash-%{+YYYY.MM.dd}"
    sniffing => true
    template_overwrite => true
    }
}
[elkuser@elk-indexer logstash-6.2.4]$ ./bin/logstash -f config/conf.d/logstash-redis.conf -t
……省略部分……
Configuration OK
[2018-04-30T12:51:23,078][INFO ][logstash.runner          ] Using config.test_and_exit mode. Config Validation Result: OK. Exiting Logstash
8.6测试架构 redis==》logstash==》elasticsearch==》kibana 是否正常工作
(1)终端运行logstash(elk-indexer主机)
[elkuser@elk-indexer ~]$ ./logstash-6.2.4/bin/logstash -f config/conf.d/logstash-redis.conf
(2)终端通过redis客户端工具推送一条消息(elk-indexer主机)
[elkuser@elk-indexer ~]$ redis-cli -h 192.168.10.22 -p 6379 -a 'redis123pass'
192.168.10.22:6379> rpush logstash-list '{"message":"Test message: Hello World","type":"test","host":"192.168.10.22"}'
(integer) 1
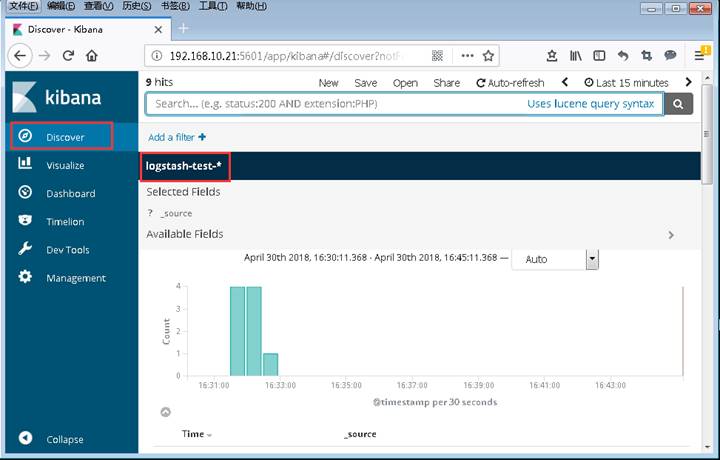
(3)通过浏览器访问kibana检验
添加索引:
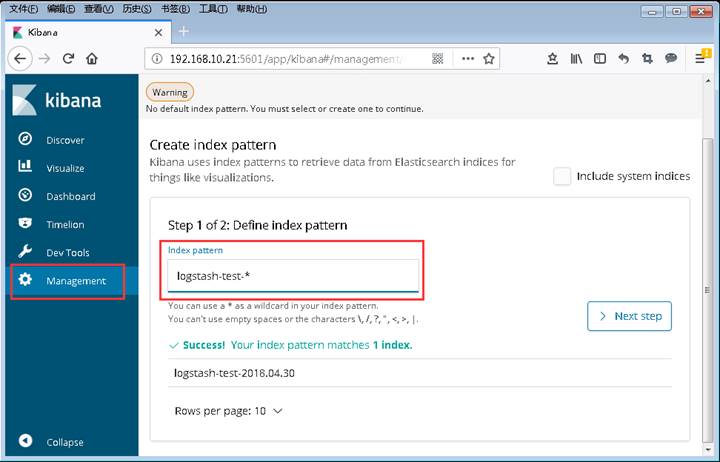
选择时间过滤字段:
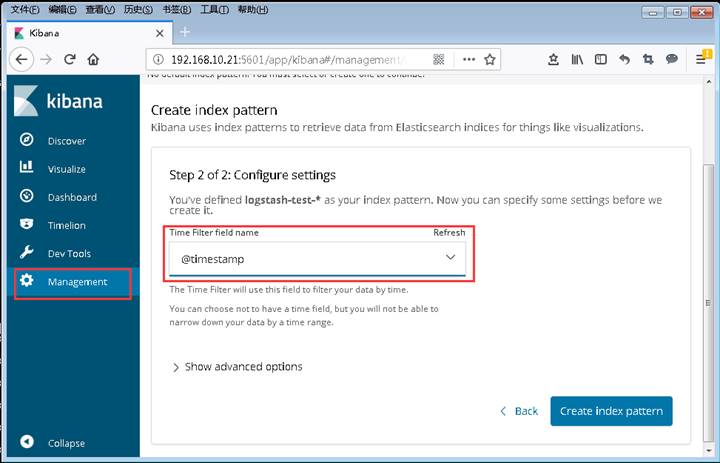
在Discover可查看到数据
8.7使用supervisor配置
(1)配置supervisor(修改相应行)
[root@elk-indexer ~]# vim /etc/supervisord.conf (值不改大,运行会报错)
minfds=65536                ; (min. avail startup file descriptors;default 1024)
[root@elk-indexer ~]# vim /etc/supervisord.conf
[program:elk-logstash]
command = /opt/elk_data/logstash-6.2.4/bin/logstash -f config/conf.d/logstash-redis.conf -w 2 -b 125
directory=/opt/elk_data/logstash-6.2.4
environment=JAVA_HOME=/opt/elk_data/jre1.8.0_171
autostart = true
autorestart = true
startsecs = 5
startretries = 3
user = elkuser
(2)启动supervisor
[root@elk-search ~]# systemctl start supervisord.service
或
[root@elk-search ~]# supervisord -c /etc/supervisord.conf
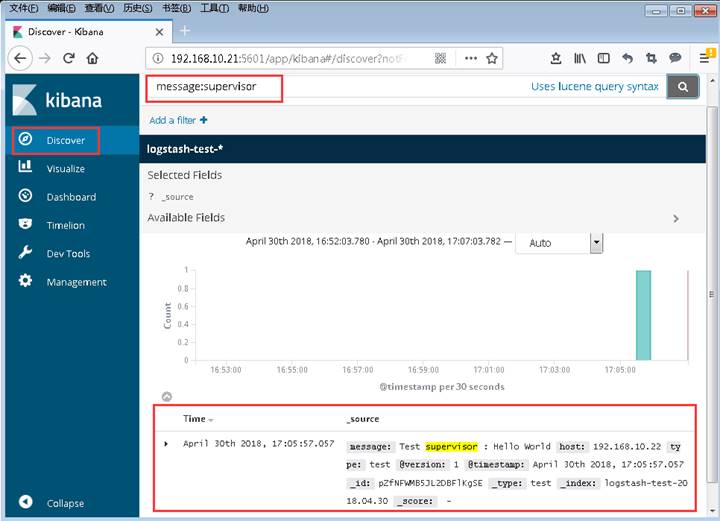
8.8测试
(1)终端通过redis客户端工具推送一条消息(elk-indexer主机)
[elkuser@elk-indexer ~]$ redis-cli -h 192.168.10.22 -p 6379 -a 'redis123pass'
192.168.10.22:6379> rpush logstash-list '{"message":"Test supervisor : Hello World ","type":"test","host":"192.168.10.22"}'
(integer) 1
(2)通过浏览器访问kibana检验
9、Shiper端filebeat安装(tx-host主机)
9.1安装
[root@tx-host ~]# curl -L -O https://artifacts.elastic.co/downloads/beats/filebeat/filebeat-6.2.4-x86_64.rpm
[root@tx-host ~]# rpm -vi filebeat-6.2.4-x86_64.rpm
9.2配置
参考:
https://www.elastic.co/guide/en/beats/filebeat/current/filebeat-module-nginx.html#_compatibility_11
https://www.elastic.co/guide/en/beats/filebeat/current/redis-output.html
(1)配置filebeat
其中要调用TX Network的redis,由于只有一台腾讯云主机,就直接在该主机上安装redis服务(redis的安装配置启动参考步骤7,此处不再重述)
[root@tx-host ~]# grep -Ev '#|^$' /etc/filebeat/filebeat.yml
filebeat.prospectors:
- type: log
  enabled: false
  paths:
    - /var/log/*.log
filebeat.config.modules:
  path: ${path.config}/modules.d/*.yml
  reload.enabled: false
setup.template.settings:
  index.number_of_shards: 3
setup.kibana:
output.redis:
  hosts: ["localhost:6379"]
  password: "redispassword123"
  datatype: "list"
  key: "logstash-tx-list"
  db: 0
  timeout: 5
(2)启用filebeat的nginx模块
Nginx模块前提条件(处理Nginx日志在Elastichsearch需要用到一些插件):
参考:https://www.elastic.co/guide/en/beats/filebeat/current/filebeat-module-nginx.html#_compatibility_11)
elasticsearch需要使用如下操作(elk-search主机):
[elkuser@elk-search ~]$ ./elasticsearch-6.2.4/bin/elasticsearch-plugin install ingest-user-agent
[elkuser@elk-search ~]$ ./elasticsearch-6.2.4/bin/elasticsearch-plugin install ingest-geoip
[elkuser@elk-search ~]$ ./elasticsearch-6.2.4/bin/elasticsearch-plugin list
ingest-geoip
ingest-user-agent
安装后重启elasticsearch
[root@elk-search ~]# supervisorctl restart elk-elasticsearch
elk-elasticsearch: stopped
elk-elasticsearch: started
启用nginx模块(tx-host主机):
[root@tx-host modules.d]# pwd
/etc/filebeat/modules.d
[root@tx-host modules.d]# ls -l nginx.yml
-rw-r--r-- 1 root root 369 4月  13 04:22 nginx.yml.disabled
[root@tx-host modules.d]# filebeat modules enable nginx
Enabled nginx
[root@tx-host modules.d]# ls -l nginx.yml
-rw-r--r-- 1 root root 369 4月  13 04:22 nginx.yml
修改nginx模块,指定日志文件路径和添加字段:
[root@tx-host modules.d]# cat nginx.yml
- module: nginx
  # Access logs
  access:
    enabled: true
    # Set custom paths for the log files. If left empty,
    # Filebeat will choose the paths depending on your OS.
    var.paths: ["/var/log/nginx/*access.log*"]    # 指定nginx的access日志路径,匹配文件名包含access.log的日志文件(因为我的网站访问日志就是以access.log作为后缀)
    prospector:
      fields:    # 添加字段,可在logstash中使用判断日志类型或来源主机,也可在Kibana中使用
        service_name: nginx
        log_type: access
        server_id: tx-host
  # Error logs
  error:
    enabled: true
    # Set custom paths for the log files. If left empty,
    # Filebeat will choose the paths depending on your OS.
    var.paths: ["/var/log/nginx/*error.log*"]    # 指定nginx的error日志路径,匹配文件名包含error.log的日志文件(因为我的网站访问日志就是以error.log作为后缀)
    prospector:
      fields:
        service_name: nginx
        log_type: error
        server_id: tx-host
9.3测试配置
[root@tx-host filebeat]# filebeat test config
Config OK
[root@tx-host filebeat]# filebeat test output
logstash: localhost:6379...
  connection...
    parse host... OK
    dns lookup... OK
    addresses: 127.0.0.1, ::1
    dial up... OK
  TLS... WARN secure connection disabled
  talk to server... OK
9.4运行
[root@tx-host filebeat]# systemctl start filebeat.service
9.5检测filebeat是否采集了数据输出到了redis中
用redis命令行客户端或桌面客户端连接redis,查看logstash-tx-list键对应记录数
[root@tx-host ~]# redis-cli -h 119.29.66.21 -p 3306 -a 'redispassword123'
119.29.66.21:3306> llen logstash-tx-list
(integer) 6    #此处显示已经有6条记录在logstash-tx-list键下
10、调整Logstash,使其实现从腾讯云主机获取日志并处理(elk-indexer主机)
10.1配置Logstash获取TX Netwok中指定的redis数据
[root@elk-indexer ~]# su - elkuser
Last login: Mon May  7 15:37:04 CST 2018 on pts/0
[elkuser@elk-indexer ~]$ pwd
/opt/elk_data
[elkuser@elk-indexer ~]$ cat logstash-6.2.4/config/conf.d/logstash-redis-tx.conf
input {
    # https://www.elastic.co/guide/en/logstash-versioned-plugins/current/v3.2.2-plugins-inputs-redis.html#v3.2.2-plugins-inputs-redis-options
    redis {
        batch_count => 1
        data_type => "list"
        key => "logstash-tx-list"
        host => "119.29.66.21"
        port => 3306
        password => "redispassword123"
        db => 0
        threads => 5
    }
}
filter {
    if [fields][log_type] == 'access' {
        grok {
            match => { "message" => "%{IPORHOST:remote_ip} - %{DATA:user_name} \[%{HTTPDATE:access_time}\] \"%{WORD:http_method} %{DATA:url} HTTP/%{NUMBER:http_version}\" %{NUMBER:response_code} %{NUMBER:body_sent_bytes} \"%{DATA:referrer}\" \"%{DATA:agent}\" \"%{DATA:http_forwarded}\""}
        }

        geoip {
            source => "remote_ip"
            target => "geoip"
            fields => ["country_name", "country_code3", "region_name", "location"]
        }
    }
    if [fields][log_type] == 'error' {
        grok {
            match => { "message" => "%{DATA:error_date} %{DATA:error_time} \[%{DATA:error_level}\] %{NUMBER:pid}#%{NUMBER:tid}: (\*%{NUMBER:connection_id} )?%{GREEDYDATA:error_message}
"}
        }
    }
}
output {
    # https://www.elastic.co/guide/en/logstash-versioned-plugins/current/v3.0.5-plugins-outputs-boundary.html#v3.0.5-plugins-outputs-boundary-options
#    stdout {
#        codec => "rubydebug"
#    }
    elasticsearch {
        hosts => ["192.168.10.21:9200"]
        index => "logstash-%{[fields][server_id]}-%{[fields][service_name]}-%{+YYYY.MM.dd}"    #默认"logstash-%{+YYYY.MM.dd}"
    sniffing => true
    template_overwrite => true
    }
}
logstash-6.2.4/config/conf.d/logstash-redis-tx.conf 文件中:
input段,配置tx-host的redis连接信息,从该redis获取数据。
filter段,使用之前在filebeat的nginx模块中定义的字段作为判断条件。grok插件分别对Nginx的access日志和error日志的内容作过滤解析,将不同的内容段映射到相应字段。geoip插件通过IP解析相应地理位置数据。
output段,配置了elasticsearch的连接信息,将最终数据输出到elasticseach中。index参数用于指定索引,后面在Kibana中会要用到。
10.2修改supervisor配置
[root@elk-indexer ~]# cat /etc/supervisord.d/elk-logstash.ini
;[program:elk-logstash]
;command = /opt/elk_data/logstash-6.2.4/bin/logstash -f config/conf.d/logstash-redis.conf -w 2 -b 125
;directory=/opt/elk_data/logstash-6.2.4
;environment=JAVA_HOME=/opt/elk_data/jre1.8.0_171
;autostart = true
;autorestart = true
;startsecs = 5
;startretries = 3
;user = elkuser
;
[program:elk-logstash-tx]
command = /opt/elk_data/logstash-6.2.4/bin/logstash -f config/conf.d/logstash-redis-tx.conf -w 2 -b 125 --path.data=/opt/elk_data/logstash-6.2.4/data_tx/
directory=/opt/elk_data/logstash-6.2.4
environment=JAVA_HOME=/opt/elk_data/jre1.8.0_171
autostart = true
autorestart = true
startsecs = 5
startretries = 3
user = elkuser
10.3重启supervisor同时启动新配置的logstash
[root@elk-indexer ~]# systemctl restart supervisord.service
11、通过浏览器访问Kibana,检查整个项目是否工作正常
11.1检查主机及运行服务是否正常:
tx-host主机运行filebea和redis
elk-indexer主机运行logstash
elk-search主机运行elasticsearch和kibana
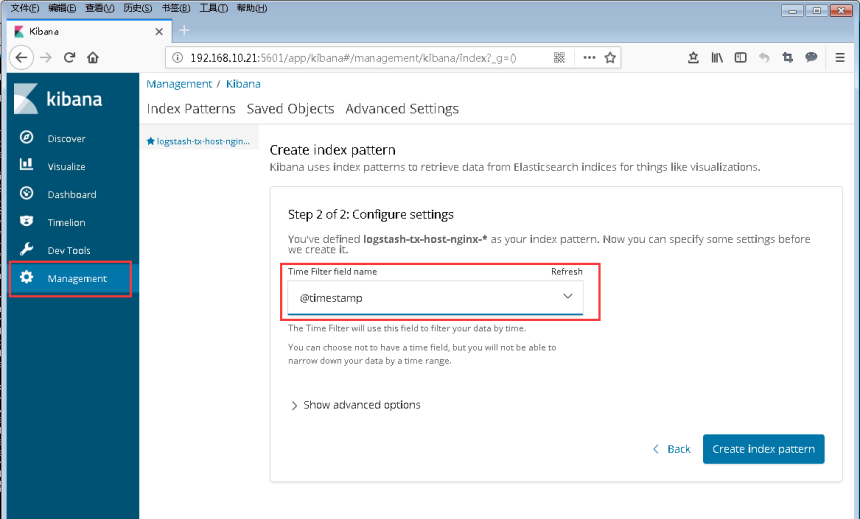
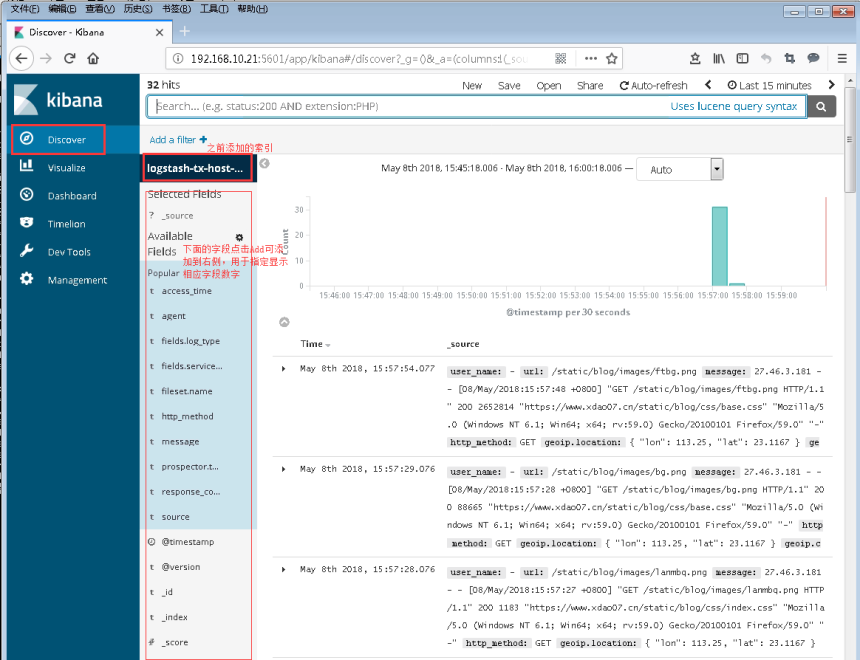
11.2浏览器访问http://192.168.10.21:5601/
(1)添加索引

(2)查看数据
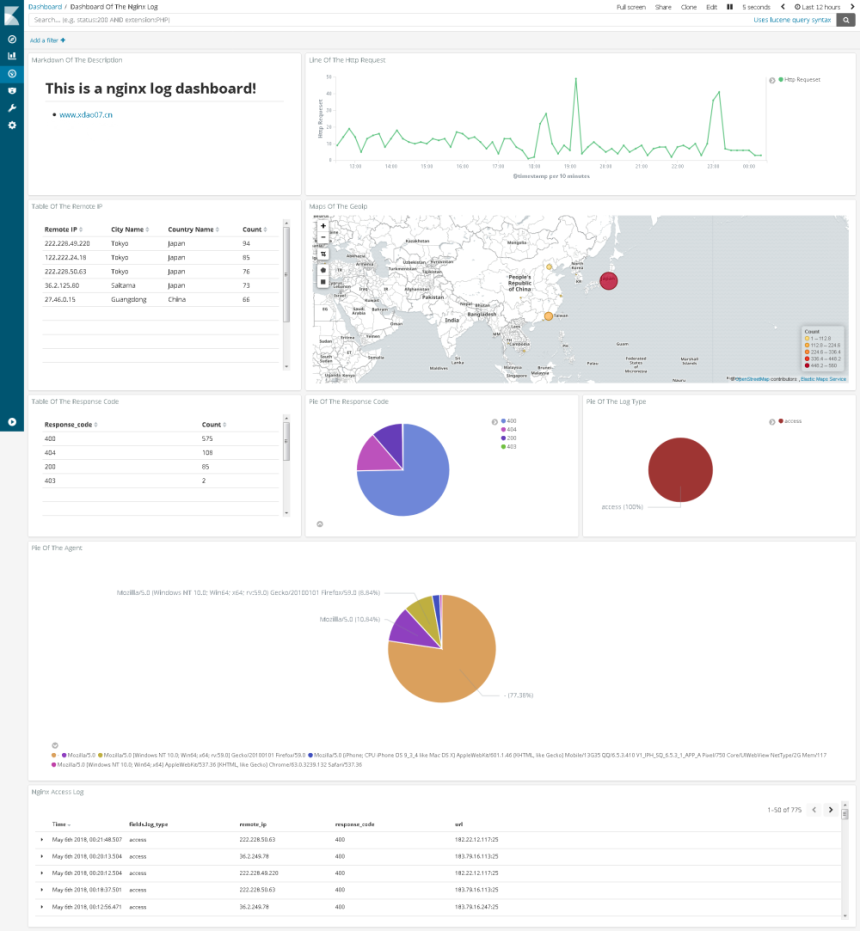
(3)我的日志数据的Dashboard图
参考:https://www.elastic.co/guide/en/kibana/6.2/getting-started.html
参考资料
(1)Redis input plugin v3.2.2
https://www.elastic.co/guide/en/logstash-versioned-plugins/current/v3.2.2-plugins-inputs-redis.html
(2)Kibana官方教程(使用官方测试数据逐步操作)
https://www.elastic.co/guide/en/kibana/6.2/getting-started.html